EMC Question of the Week: December 27, 2021
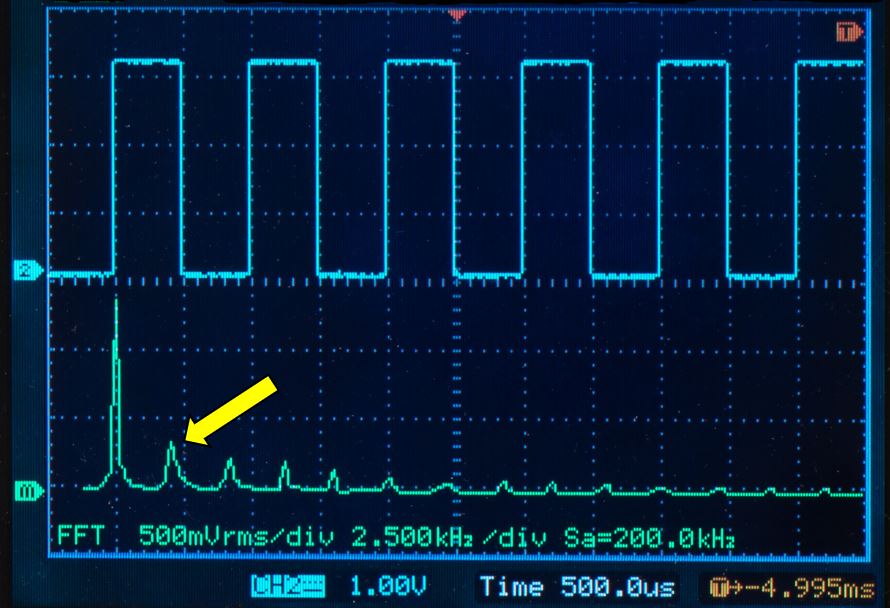
In the digital oscilloscope display shown in the figure, what is the frequency of the second peak in the FFT?
- 1 kHz
- 2 kHz
- 3 kHz
- 4 kHz
Answer
The correct answer is “c.” The time-domain waveform (blue trace) is a square wave with a period of 1 msec (fundamental frequency of 1 kHz). While there is no 0-Hz reference for the FFT trace, we know that the first peak is at 1 kHz. The second peak has an amplitude that is 1/3rd of the first peak and occurs at the 3rd harmonic of 1 kHz which is 3 kHz.
We arrive at the same conclusion by noting that the horizontal scale for the FFT trace is 2.5 kHz/division. The first peak (at 1 kHz) lines up with the first division line so the second division line represents 3.5 kHz. The second peak occurs 4/5ths of the way between the two division lines at 3 kHz.
Note: The amplitude of the square wave is approximately 3 volts peak-to-peak, so the rms amplitude of the first harmonic is 0.45 x 3 = 1.35 volts. The amplitude of the 3rd harmonic is 1.35/3 = 0.45 volts.
Have a comment or question regarding this solution? We'd like to hear from you. Email us at