
EMC Question of the Week: October 26, 2026
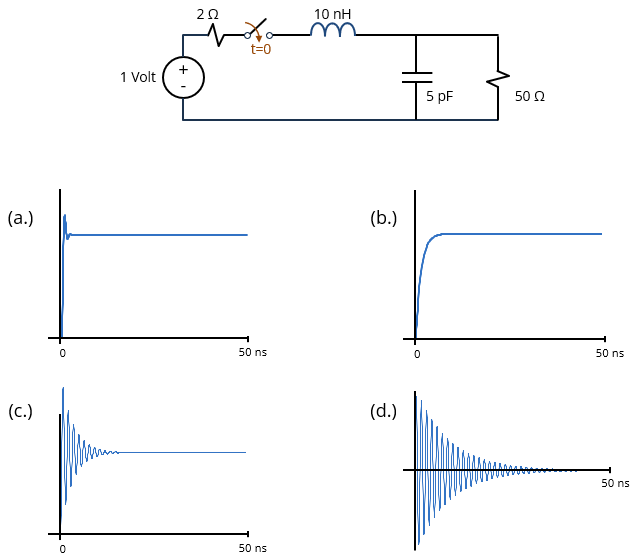
A 1-volt, 2-Ω source is connected to the 50-Ω, 5-pF input of a 1-GHz oscilloscope through 10 nH of connection inductance. Which of the plots in the figure most accurately represents the voltage waveform measured by the oscilloscope?
Answer
The best answer is “a.” This is an LC circuit with both series and parallel damping resistances. The resonant frequency is 1/2π√(LC) or about 712 MHz. At the resonant frequency, the impedance of the inductance is j2πfL or about j45 Ω. The series damping resistance is 2 Ω, which is much smaller than 48 Ω, so it has a negligible impact. The impedance of the capacitor at resonance is −j/2πfC or about −j45 Ω. This is approximately equal to the 50-Ω impedance of the parallel resistance. In this case, the circuit is slightly underdamped (Q = 1), so we expect the measured waveform to overshoot the steady-state voltage with relatively little visible ringing.
Option (b.) shows an overdamped response, which would be consistent with a much larger source resistance or a much smaller load resistance.
Options (c.) and (d.) are both underdamped with a much higher Q-factor (Q ≈ 10). Furthermore, Option (d.) has the wrong steady-state value.
Note that we specified the bandwidth of the oscilloscope in order to ensure that it is capable of measuring the response in (a.). A 1-GHz bandwidth corresponds to a minimum measurable transition time of about 350 ps. This is lower than the circuit's transition time of approximately 1 ns. Note that a slower oscilloscope (e.g., 100 MHz) would display a voltage waveform that resembled Option (b.).
Have a comment or question regarding this solution? We'd like to hear from you. Email us at