
Chapter 4 Lab Exercise: Spectrum Analyzer Measurements of Impulses
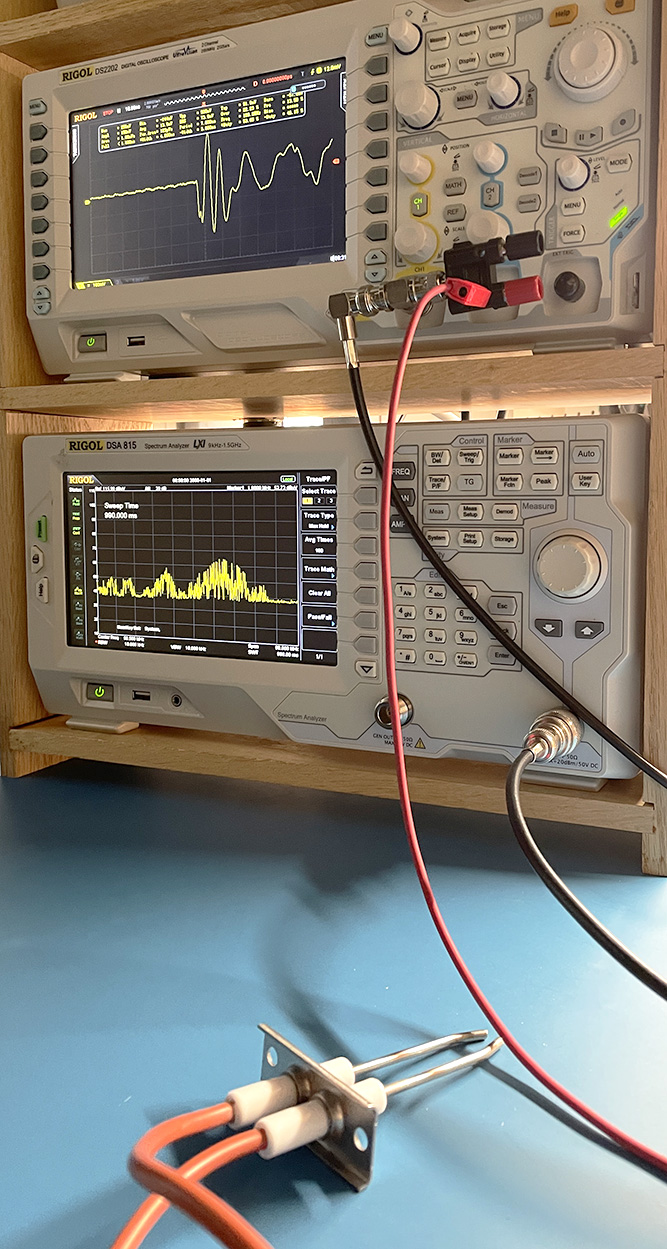
Many EMI sources produce short pulses, either randomly or periodically. For example, brushed DC motors, power inverters, solenoids, and mechanical relays are common sources of pulsed noise. Since conducted and radiated emissions measurements are usually made in the frequency domain, it's important for EMC engineers to understand how short pulses in the time domain affect frequency-domain measurements.
Preparation: Students should read Chapter 4 before starting this exercise. They should be familiar with the basic operation of traditional EMI test receivers with peak, quasi-peak, and average detectors.
Equipment Required:
- transient source such as an ESD simulator or spark generator
- oscilloscope with a bandwidth ≥ 500 MHz
- spectrum analyzer or EMI test receiver
Procedure:
Step 1: Connect an antenna to both the oscilloscope and the spectrum analyzer using coaxial cables and a T-connector. The antenna could simply be a 50-cm length of wire that connects to the center conductor of the scope input. Use the 50-Ω input for the oscilloscope.
Step 2: Set the spectrum analyzer to view frequencies from 1 MHz to 100 MHz. Set the resolution bandwidth to 10 kHz.
Step 3: Set the oscilloscope to single-sweep mode. Start with an amplitude setting of 100 mV/division and a time base of 10 ns/division.
Step 4: Create an arc in the general vicinity of the antenna. Be sure not to arc directly to the antenna or anything it's connected to. Did the discharge trigger the scope? Did it register on the spectrum analyzer? If not, adjust the scope settings and/or the distance between the arc and the antenna until your arcs register on both the scope and the analyzer. Then adjust the time base of the oscilloscope to get a clear picture of the transient waveform in the time domain.
Step 5: Clear the spectrum analyzer display, then put it in peak-hold mode. Create arcs repeatedly to the same spot. Note that spikes appear in the analyzer display at frequencies corresponding to the sweep position at the instant the arc is detected. Continue creating new transients until a clear pattern emerges on the display of the spectrum analyzer. If all the transients were identical, the shape displayed on the analyzer would be the energy spectrum of the transient. Since there is a statistical variation in the transient waveforms, the shape displayed on the analyzer is more of a worst-case representation of the energy at each frequency.
Step 6: Clear-write the screen and set the resolution bandwidth to 1 MHz. Put the analyzer in peak-hold mode and repeat the measurement. What effect does a wider resolution bandwidth have on the amplitude and shape of the measured response? Why?
Step 7: Choose one of the highest frequencies in the response and perform a quasi-peak measurement at that frequency while arcing repeatedly. What is the quasi-peak value?
Step 8: Choose one of the highest frequencies in the response and perform an average measurement at that frequency while arcing repeatedly. What is the average value?
Step 9: At what repetition rate would you expect the quasi-peak value to be within 6 dB of the peak recorded value? Why?
Step 10: What kinds of sources might create transients with that repetition rate?
Notes:
An ignitor for a propane grill can be an inexpensive alternative to an ESD simulator for this exercise. Alternatively, you can build your own spark generator with a battery, a switch, and a transformer. Connect them so that closing the switch creates a current in the primary of the transformer. When the switch is opened, the sudden change in the primary current produces a transient voltage across the output of the secondary. This can be connected to conductors that form a spark gap.
This lab exercise can also be performed using a digital oscilloscope with an FFT function. In that case, adjustments to the resolution bandwidth, reference level, and video bandwidth would be replaced by adjustments to the sampling frequency, displayed amplitude, and averaging functions. This illustrates how real-time spectrum analyzers can mimic the transient response of traditional spectrum analyzers.